

Are you in a saturated market? If so, I got good news. UX is the absolute differentiator. Improve your UX, and you improve your market standing.
However, you can only improve something you can measure. And this is exactly what this article is about. Understanding and effectively measuring UX metrics can significantly impact virtually all business vitals. This includes product activation, retention, and referral rates.
This article delves into what UX metrics are, their types, how to measure them, and how to choose and prioritize the right ones for your product. Let’s dive right in.

What Are UX Metrics?
UX metrics are specific measurements that help evaluate, among other things, the effectiveness, efficiency, and satisfaction of a user's interaction with a product. In a nutshell, it's a number that describes how happy your users are.
Another way to look at it is to conceptualize UX as a combination of utility, usability, and desirability. As such, a UX metric would be a qualitative or quantitative value as to how much utility, usability, or desirability there is in a product.
It’s important to note that UX metrics do not exist in isolation; they are closely linked to higher-level product metrics, particularly those in the AARRR (Acquisition, Activation, Retention, Referral, Revenue) framework. These metrics have different weights depending on the industry. For example, for SaaS UX, retention rate is key for sustainable business growth, while e-commerce products would zero in on conversion.

UX metrics primarily impact activation, customer experience, retention, and referrals, although they also influence other metrics indirectly.
Now that we know what UX metrics are, let’s briefly go over why they matter for improving customer satisfaction.
{{{{service-card}}}}
The Shift to PLG or Why UX Metrics Matter
Coined in 2016, the concept of product-led growth has been steadily gaining favor. The term was developed in opposition to sales-led growth (SLG). SLG entails the typical division of roles among marketing, sales, and product teams. This is the way things have always been.

On the other hand, the concept of PLG stipulates that product is what does the marketing and selling. Great products, according to the PLG principles, spread via word of mouth and convert users via exceptional UX.
This approach necessitates a deep understanding and meticulous tracking of all product metrics by UX designers and other relevant stakeholders.
In other words, experience design and high user satisfaction metrics are your head of sales. This is what fundamentally moves the needle in product success by prompting users to recommend your product to others.
Types of UX Metrics: How to Measure UX
UX metrics can roughly be categorized into three main groups: performance metrics, self-reported metrics, and business metrics. Additionally, we’ll talk about more strategic metrics that are impacted by numerous factors, not just UX.

Performance Quantitative Metrics in User Experience
Performance metrics are tied to usability and are typically measured through usability testing.
As a reminder, for a usability testing session, you need a moderator (typically a designer), users for testing (at least five), and a software or prototype to test. Then, a moderator would have users interact with that software to pinpoint usability issues. In this context, issues are poor metrics.
Such key performance metrics include:
- Task success: what percentage of users can successfully complete tasks;
- Efficiency: how quickly users can complete tasks;
- Time on task: the amount of time users spend on tasks;
- Learnability: how easily new users can learn to use the product;
- Error rates: the frequency and types of errors users encounter.

The list is not comprehensive. You’re welcome to come up with your own metrics that make the most sense for your product.
Self-Reported Qualitative Metrics in UX Design
Self-reported metrics are based on user feedback and can be gathered through various methods such as user interviews and satisfaction surveys. Important self-reported metrics include:
- Likert scale ratings: users rate their experience on a scale, typically from 1 to 5 or 1 to 7, providing insight into customer satisfaction and user-friendly design;
- Open-rnded questions: qualitative feedback on user experience;
- Net promoter score (NPS): measures user loyalty and likelihood to recommend the product or service, providing insight into customer satisfaction.

Usability testing aside, you may also gather usage metrics for things like drop-off rates, page dwell times, etc. In isolation, these may not offer a lot of insight, however, they are important clues to get you thinking in the right direction.
Behavioral Metrics
Behavioral metrics are less commonly used but provide valuable insights into user interactions. These include customer experience metrics:
- Eye tracking: Analyzes where and how users look at the screen to enhance their user journey;
- Click heatmaps: Shows areas of the screen where users click most frequently.
In combination with other metrics, these will help you find out whether your product offers a seamless experience.
Business Metrics
While not exclusively UX metrics, business metrics like conversion rates, time to first purchase, and lifetime value are significantly influenced by the user experience. As such, they shouldn't be disregarded.
{{case-study}}
The business metrics typically focus on the number of users who complete a desired action (typically, making a purchase). These are exceptionally useful in helping designers advocate their decisions with business stakeholders.
How to Measure Key UX Metrics
Now that we've covered what the most common metrics are, let's focus on how you can measure them.
Performance Metrics
To measure performance metrics, conduct user testing sessions. Analyze recordings of these sessions to establish a baseline and track improvements with numerical data over time. As an alternative to recordings, you may also have a dedicated person on the meeting who takes notes and calculates relevant information.
Usability testing is one of the most important UX activities. You should conduct this activity regularly (especially early into the product development) to ensure your app is highly useable.
Self-Reported Metrics
Incorporate self-reported metrics into regular processes. Use qualitative interviews to stay in touch with user needs and employ Likert scale questions to gauge satisfaction.
Gauging these metrics will help you stay in touch with the market. This type of user research is sometimes referred to as customer development and is fundamental for healthy business growth.
Behavioral Metrics
Although setting up behavioral metrics like eye tracking can be challenging, the insights they provide can be invaluable for refining the user experience.
Eye tracking requires specialized hardware (e.g., Tobii Pro), analysis software (e.g., iMotions), and a controlled environment. Data from heatmaps and gaze plots help refine UI/UX by identifying unnoticed elements and navigation issues
How to Choose the Right UX Metrics for Your Product
Selecting the right UX metrics involves aligning them with strategic, higher-level product metrics. For instance, if data shows that Slack users who invite at least five team members are more likely to convert to paying users, optimizing and tracking this behavior becomes a priority, especially if better conversion is among the strategic goals of the product.
Strategic goals aside, let’s cover performance, self-reported, and behavioral metrics.
Performance Metrics (time on task, task success rate, etc)
Performance metrics require little prioritization. Their value is in creating a baseline for further comparison and in evaluating usability for newly designed flows using quantitative data. As outlined in the previous section, here are a few common performance metrics: task success, efficiency, time on task, learnability and error rates.
Self-Reported Metrics (NPS, user satisfaction, etc)
Embed self-reported metrics into your internal processes. Regular qualitative interviews and Likert scale surveys are essential for maintaining user satisfaction. The question is what you should ask.
It’s typical to integrate NPS surveys into the product experience to gather quantitative data on customer experience. This should also ensure you’re getting a good number of answers across time.
Behavioral Metrics (retention rate, adoption, etc)
While more complex to implement, behavioral metrics provide deep insights into user interactions and can guide significant UX improvements.
How to Prioritize User Experience Metrics
With UX metrics, the approach we suggest is to prioritize them bottom-up: starting from basic usability and then climbing all the way up to strategic goal. In a nutshell, there’s little sense of long-term strategic decisions without having the basic usability ensured.
Usability Metrics
Prioritize usability metrics first, as a product must be usable before addressing other aspects. When users interact with your product and can't complete a specific task, you have no way of knowing whether your product has market potential. Once these indicators are subpar, they need immediate attention, because poor usability directly trickles down to the business bottom line.
Business Goals
Once usability is ensured, focus on profitability and customer retention to improve user engagement and help business stakeholders achieve their goals. Then, you identify areas for improvement and make appropriate design decisions.
Strategic Goals
Once business goals are taken care of, you should then align your metrics with strategic goals that support more long-term objectives. For instance, if new competition emerges, focus on metrics related to customer retention, such as repeat purchase rates. Standardizing these measurements often requires a structured approach, and using an OKR Excel template helps maintain consistency while tracking progress against these high-level targets.
Best Practices to Improve UX metrics
Improving UX metrics requires a structured, data-driven approach that enhances usability, efficiency, and user satisfaction. Below are key areas where UX teams should focus to optimize their product experience.
Seamless Navigation
A well-structured, intuitive navigation system ensures users can find what they need quickly, reducing frustration and drop-off rates. To improve navigation:
- Simplify the information architecture – Organize content logically based on user behavior and expectations to improve task success rate.
- Ensure clear labeling – Use familiar, descriptive terms rather than jargon or creative wording.
- Minimize steps to key actions – Reduce the number of clicks or screens required to complete common tasks.
- Use visual hierarchy effectively – Guide users through pages with clear headings, button placements, and contrast.
Measuring improvements in navigation involves tracking time-on-task, page depth, and bounce rates. User testing and heatmaps can provide additional insights into pain points.
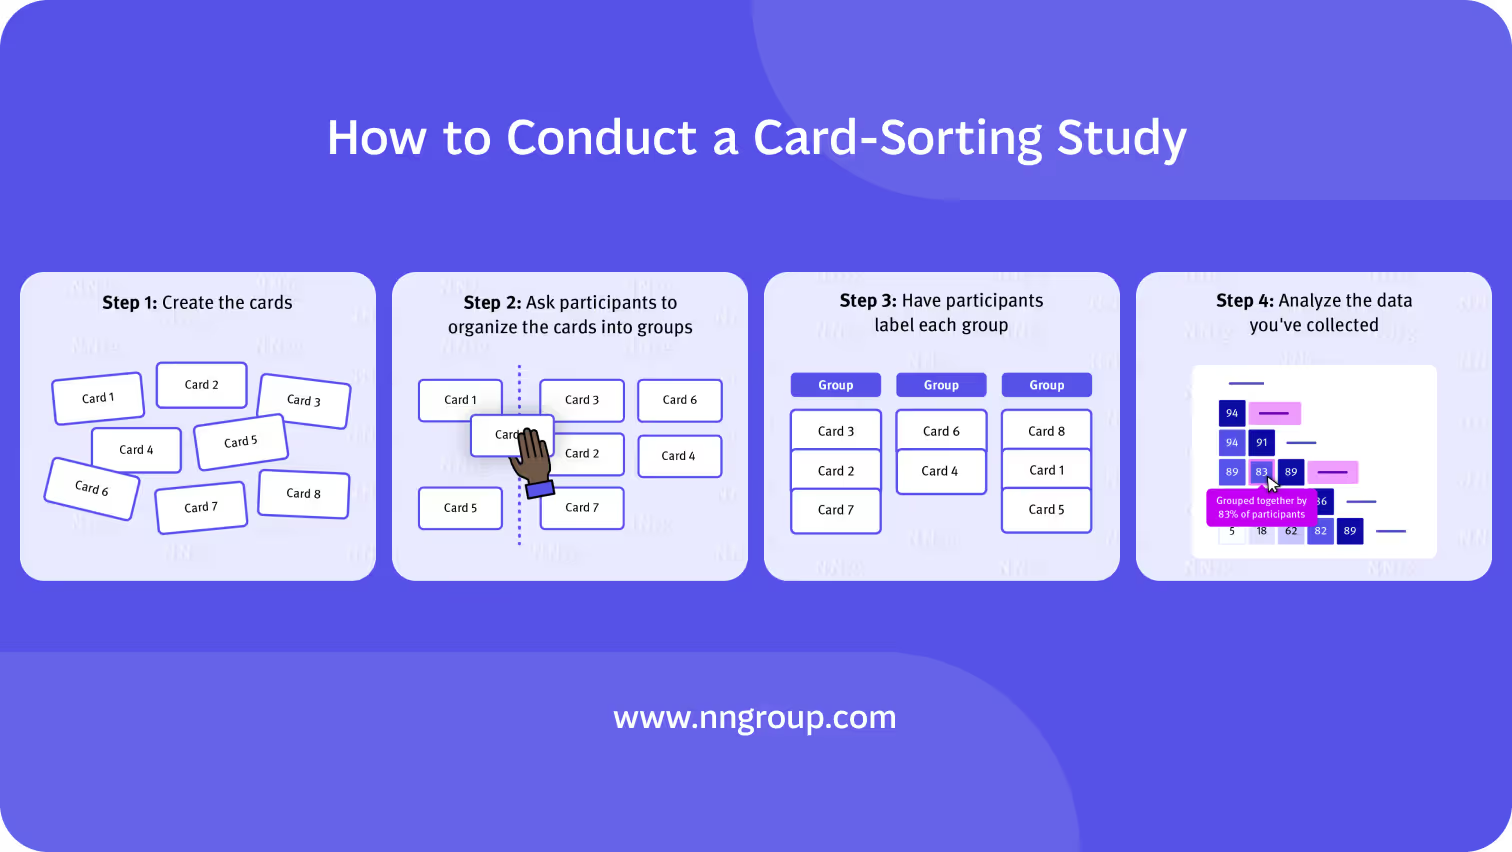
A useful activity when coming up with navigation is card sorting. In a nutshell, this activity requires users to sort and categorize features and other product entities into groups that make sense to them. This way you meet user expectations and ensure good user engagement and satisfaction.
Conversion Rates
Optimizing conversion rates is essential for both user experience and business success. Note that a conversion does not always imply a purchase, but rather a desired action whatever the context may be. Improving conversions often requires addressing friction points in user flows:
- Streamline onboarding: remove unnecessary steps and provide guided experiences to help users achieve value faster;
- Improve form usability: use inline validation, autofill, and clear error messages to reduce form abandonment;
- A/B test CTAs and landing pages: test different designs, wording, and placements to see what drives engagement;
- Reduce cognitive load: minimize choices and distractions that can overwhelm users during key decision-making moments.
.avif)
Measuring conversion rate improvements involves analyzing funnel completion rates, drop-offs at critical steps, and heatmaps for interaction patterns.
Task Success & Error Rates
Task success and error rates provide direct usability insights. To enhance these metrics, consider conducting UX research.
- Conduct usability testing: identify pain points where users struggle to complete key tasks;
- Improve feedback mechanisms: provide real-time validation, error prevention, and clear messaging;
- Optimize UI interactions: ensure buttons, links, and forms behave as expected across devices;
- Prioritize accessibility: follow WCAG guidelines to ensure inclusivity for all users.
Error rates should be monitored through usability testing, bug reports, and behavioral analytics, such as rage clicks or repeated failed attempts.
%202.avif)
Optimize Performance
A slow or unresponsive product negatively impacts UX metrics across the board. To enhance performance:
- Optimize load times: minimize heavy scripts, compress images, and implement caching strategies.
- Ensure mobile responsiveness: adapt layouts and interactions for different screen sizes and input methods.
- Reduce interface lag: use skeleton loaders, micro-interactions, and progressive rendering to create a smoother experience.
Performance improvements should be measured with tools like Core Web Vitals, time-to-interaction metrics, and real user monitoring. Using Xurrent ITSM can also help teams track service performance, incidents, and operational issues that impact the overall user experience.
User Engagement & Retention
Keeping users engaged over time requires more than usability—it demands value and habit formation:
- Personalize experiences – Use data to surface relevant content, recommendations, and settings.
- Encourage habit loops – Implement features like streaks, achievements, or reminders to reinforce usage patterns.
- Optimize empty states – Provide guidance or motivation when users first interact with a new feature.

Retention improvements can be tracked through cohort analysis, churn rate monitoring, and user feedback surveys.
Conclusion
In summary, understanding and effectively measuring UX metrics is crucial for any product aiming for success. By categorizing and prioritizing these metrics, and aligning them with broader business goals, you can create a user experience that not only satisfies but delights your users, driving long-term growth and success.
We helped raise $50 mil. in funding and won 2 design awards. Here's how.
Service short description